The Elliott Wave Theory is a popular technical analysis method used to forecast financial market movements by identifying repetitive wave patterns. If you're building a knowledge base for an Elliott Wave website, you'll want to cover fundamental concepts, advanced strategies, and practical applications. Here are some key sections you might include:
1. Introduction to Elliott Wave Theory
Overview of Ralph Nelson Elliott's Discovery
Core principles : Wave Structure, Fractals, and Market Psychology
Why Traders use Elliott Wave in Technical Analysis
2. The Wave Structure
Impulse Waves (Motive Waves) : The Five-Wave Movement in Trend Direction
Corrective Waves : The Three-Wave Pattern that Retraces Previous Moves
Rules and Guidelines to Differentiate Wave Types
3. Fibonacci Ratios and Elliott Waves
The Connection between Fibonacci Retracements and Wave Formations
Key ratios : 38.2%, 50%, 61.8%, and Extensions
How Traders use Fibonacci in Wave Projection
4. Advanced Patterns
Leading and Ending Diagonals
Flat, Zigzag, and Triangle Corrections
Extensions and Truncations in Waves
5. Practical Applications
How to Apply Elliott Waves in Forex, Stocks, and Cryptocurrency Trading
Combining Wave Theory with other Technical Indicators
Common Mistakes and how to Avoid them
6. Tools & Resources
Recommended Books, Websites, and Software for Elliott Wave Analysis
Live Market Examples and Case Studies
FAQ Section Addressing Common Trader Doubts
Why Should I use EW ?
When comparing Elliott Wave Theory to many other trading indicators, several key differences stand out:
Examples from our markets
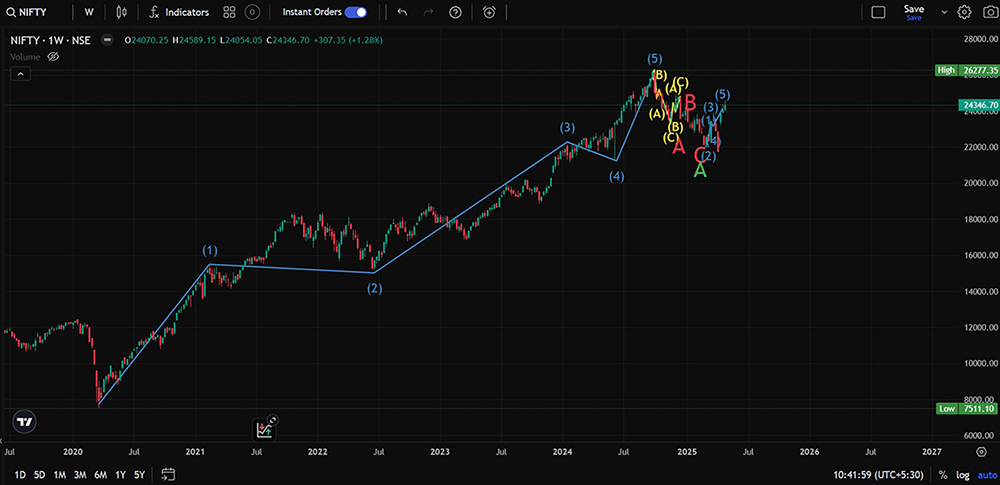
Are we in cyclical down turn?
Not really, so far looking at current Degree off Impulse sell off.
Can we Forecast markets and what’s the level of accuracy?
Yes, fore casting is possible and you are well prepared to understand gain and losses arising of trading.
How far we can use this tool to forecast?
Its possible From Minute time frame to Monthly and yearly, Larger Trend report is accessible on front page, for lower time frame and are accessible through login.
Conceptual Foundation
Elliott Wave Theory
Market Psychology & Cycles : Elliott Wave is rooted in the idea that market movements are driven by collective investor psychology that unfolds in repetitive, fractal wave patterns. This approach emphasizes the natural cycles of optimism and pessimism that drive market prices.
Forecasting Future Movements : It is primarily used as a predictive framework. By identifying wave patterns, traders aim to forecast the future course of the market before it fully unfolds.
Other Trading Indicators
Mathematical and Statistical Basis : Many common indicators-such as the Relative Strength Index (RSI), Moving Average Convergence Divergence (MACD), or Bollinger Bands-are based on numerical calculations drawn from historical price and volume data.
Reactive Signals : These indicators often work by providing signals (like overbought/oversold conditions or crossovers) based on recent price behavior. They tend to react to market changes rather than predicting them from underlying cycles.
Methodology and Interpretation
Elliott Wave Analysis
Subjectivity and Expertise : Elliott Wave analysis requires a thoughtful interpretation of price charts. Two traders may view the same chart differently, as recognizing the correct wave counts can be subjective and dependent on the analyst’s experience.
Pattern Recognition : It involves identifying complex wave patterns that can span across multiple timeframes, making the analysis both art and science.
Other Trading Indicators
Objective Calculations : Trading indicators provide more clear-cut, formula-driven signals. Their outputs tend to be less open to subjective interpretation because they adhere to standardized parameters.
Simpler Signal Generation : Indicators like RSI or moving averages offer binary signals (such as buy/sell triggers), making them easier for many traders to follow without deep qualitative analysis.
Timeframes and Flexibility
Elliott Wave Theory
Fractal Nature : The theory is highly adaptable since it applies to all market timeframes-from minute charts to weekly or monthly charts. Its fractal nature means the same patterns can appear at different scales.
Holistic Market Narrative : It provides a broad narrative by considering how short-term fluctuations fit into longer-term cycles.
Other Trading Indicators
Timeframe Specificity : While many indicators can also be applied across different timeframes, they sometimes miss the larger, cyclical picture that Elliott Wave Theory attempts to capture.
Complementary Role : Indicators often serve to verify or supplement a broader market analysis rather than provide the whole market cycle picture on their own.
Predictive vs. Reactive Nature
Elliott Wave Theory
Predictive Framework : It aims to forecast potential turning points and price targets by analyzing the structure of the waves. Its forward-looking approach attempts to map out future trends based on historical patterns.
Other Trading Indicators
Reactive Performance : Indicators typically respond to price changes already made, which can lead to a lag in signal generation. For example, moving averages smooth price data and deliver signals after the fact.
Confirmation Tools : Many traders use these signals as a form of confirmation for analyses conducted using Elliott Wave Theory, combining the strengths of both predictive and reactive methodologies.
Integration in Trading Strategies
Many experienced traders find that while Elliott Wave provides a sophisticated framework for understanding market cycles, its subjectivity can be challenging for consistent application. To mitigate this, numerous traders combine Elliott Wave analysis with other technical indicators. For example, using RSI or MACD to confirm a potential wave reversal enhances confidence in the trading decision. This blended strategy allows for the richness of wave narrative analysis alongside the objectivity of quantitative signals.
In summary, Elliott Wave Theory and traditional trading indicators operate on fundamentally different premises-one leaning on market psychology and pattern recognition, and the other on mathematical, reactive measures. Both offer valuable insights, and many traders choose to integrate them to build robust, multi-dimensional trading strategies.
Would you like to explore strategies for integrating these methods or perhaps some case studies demonstrating their combined use?
Case Study 1
Below are a few detailed case studies that illustrate how traders have successfully integrated Elliott Wave analysis with other trading indicators. These examples show the benefits of blending a predictive, pattern-based framework with objective, quantitative signals to refine entry and exit points.
Case Study 1: Equity Market Reversal Using Elliott Wave and MACD
Context : In early 2020, as global uncertainties rattled equity markets, technical analysts began noticing that the S&P 500 was exhibiting a classic Elliott Wave count. An experienced trader identified a completed five-wave impulsive move, suggesting that the market might soon enter a corrective phase.
Methodology
Elliott Wave Analysis : The trader performed a detailed wave count on daily charts and determined that the impulse wave (waves 1 through 5) had ended.
MACD Confirmation : Concurrently, the MACD indicator began to show a bullish divergence as the price dipped lower. A narrowing MACD histogram and an imminent crossover provided an objective confirmation of the impending reversal.
Additional Tools : Along with the above, the RSI dipped into oversold territory near key Fibonacci retracement levels (38.2% and 50%), further reinforcing the case for a reversal.
Outcome & Insights
Once the confirmation from MACD and RSI aligned with the Elliott Wave projection, the trader entered a long position near the predicted corrective wave’s start. The market subsequently reversed, validating the integration of these methods. This case study underscores that while Elliott Wave analysis offers a narrative on market psychology and future movements, pairing it with momentum indicators like MACD can reduce subjectivity and improve timing.
Case Study 2: Currency Pair Trend Analysis with Elliott Wave and RSI
Context : In the mid-2019 forex market, the EUR/USD pair was in a strong uptrend. A technical analyst used Elliott Wave theory to map the market’s structure and identified a five-wave impulsive move that appeared to be complete. However, the market’s inherent noise in the forex arena demanded additional confirmation to avoid premature exits.
Methodology
Elliott Wave Analysis : The wave count indicated that the fifth wave was concluding, suggesting a pending corrective pullback.
RSI Integration : The Relative Strength Index (RSI) dropped into the oversold region (below 30) at the wave completion point. This provided an objective signal that the buying pressure might soon reemerge.
Fibonacci Support : The analyst overlaid Fibonacci retracement levels to pinpoint support areas, which coincided with the oversold region indicated by the RSI.
Outcome & Insights
With the Elliott Wave count signaling the end of an impulsive move and the RSI confirming oversold conditions at key Fibonacci levels, the trader used this confluence of signals to decide on position adjustments. This approach helped mitigate risk by showing that while the market might briefly retrace, a meaningful rebound was likely imminent. The integration of RSI provided an extra layer of data beyond the subjective wave count, demonstrating the strength of linking objective and subjective methods.
Case Study 3: Navigating Crypto Volatility with Elliott Wave, Bollinger Bands, and MACD
Context : Cryptocurrency markets, particularly Bitcoin, are known for their high volatility and less predictable behavior. In a recent trading scenario, Bitcoin’s chart displayed complex wave structures that could be interpreted as either a five-wave impulsive move or an emerging corrective pattern.
Methodology
Elliott Wave Analysis : The trader performed a detailed count, hypothesizing that a five-wave structure was unfolding. However, the unusual price action raised uncertainty about the final wave’s completion.
Bollinger Bands : To measure volatility and identify potential breakouts, Bollinger Bands were used. As the bands contracted, it signalled that volatility was about to increase, a common precursor to a significant move.
MACD Signals : The MACD provided momentum cues. A bullish divergence accompanied the price nearing the upper Bollinger Band, suggesting that the corrective wave might indeed be ending, and a fresh uptrend was on the horizon.
Outcome & Insights
The trader waited for the MACD to confirm a momentum shift while the price respected the Bollinger Band’s dynamic support/resistance zones. When the signals converged with the Elliott Wave projection, a decisive entry was made. This case study shows that even in markets where price action is wild and seemingly erratic, layering multiple analyses can help build a more robust trading signal. Additionally, managing risk is crucial in volatile sectors, making timely reliance on numerical indicators all the more vital.
Additional Considerations and Next Steps
While these case studies highlight real-world scenarios, it’s important to remember that no technical analysis method offers infallibility. Traders often benefit from:
Combining Multiple Time Frames : Analyzing wave counts and indicator signals on different timeframes can filter out noise and enhance reliability.
Rigorous Risk Management : Incorporating stop-loss orders, position sizing, and regular re-assessment of wave counts ensure that unexpected market moves are managed.
Diverse Indicator Portfolio : Experiment with other indicators (e.g., Stochastics, volume oscillators) in tandem with Elliott Waves to further improve the signal-to-noise ratio.
Mouse Trap
Trading signals generated via trends decipher methodology be the EW, Indicators, Harmonics, Time cycles. Choose the one with Edge.
“NO EDGE KNOW HEDGE